10 Best Log Monitoring Tools in March 2026: Top Handpicked List
![10 Best Log Monitoring Tools in [monthyear]: Top Handpicked List 1 Log Monitoring Tools](https://googiehost.com/blog/wp-content/uploads/2025/11/Log-Monitoring-Tools-1024x576.jpg)
Log monitoring is one of the most important tasks that every IT team does, but the thing is that if you do it manually, it can quickly turn into a big tension. When logs pile up, checking them by hand becomes slow and full of chances for minor mistakes. One missed error can lead to downtime or security risks.
The best log monitoring tool is the exact solution to the problem mentioned above and is also a smarter and safer choice.
These tools help the IT support teams & the developers, who manage their own servers. With a log monitoring tool, they can easily track errors, understand system performance, fix issues faster and keep everything running smoothly.
And as we know how eager you are to explore the best log monitoring tools available today, we’ve provided a fresh and updated list of the best log monitoring tools of 2025. We’ve also included their unique features, free plans or free trials (if available) and their starting prices, so you can understand what each tool offers and which one fits your needs.
Now, let’s jump in and explore each log monitoring software in detail… 👍
What are Log Monitoring tools?
Log monitoring tools are software that automatically watch, collect and check the logs created by computers, apps, servers and networks.
You can think of logs as a digital summary that your system writes whenever something happens like a file opening, an error, a login attempt or even a server crash at times of huge traffic or heavy resource usage.
If you try to check all these logs manually, it becomes super confusing, and you may miss important issues.
That’s where log monitoring tools help.

These tools read and analyze logs for you, show everything in a simple dashboard, highlight problems instantly and even warn you before something goes wrong. They are useful for many people like the IT admins, developers, security teams and even students learning tech.
These users can track system health, find errors quickly, improve performance and detect suspicious activities. In a nutshell, log monitoring tools make your life easier by saving time and helping you understand what’s happening inside your systems in a clear and stress-free manner.
10 Best Log Monitoring Tools in 2026
There are hundreds of log monitoring tools online, but you can’t trust all of them. Some have serious issues like poor privacy (they sell the data to the 3rd party), confusing dashboards or hidden limitations. After sincere hard work by our tech team, we’ve listed the best log monitoring tools for 2025, so you get real information, not just random suggestions.
⏰ TL;DR:
1. LogFusion – Overall Best Log Monitoring Tools
2. Papertrail (SolarWinds)– Best Log Monitoring Tools
3. Mezmo – Best Log Analysis Monitoring Tools
4. Sematext Logs – Centralised Log Monitoring Tools
5. Sumo Logic – Cloud-Native Analysis And Log Monitoring Tools
6. Datadog – All-in-One Log Monitoring Tools
7. Dynatrace – AI-powered Log Monitoring Tools
8. Splunk – Codeless Interface Log Monitoring Tools
9. Logstash – Open-Source Log Monitoring Tools
10. LogicMonitor – Infrastructure Log Monitoring Tools
Our tech team researched every tool deeply, tested each tool personally, checked how user-friendly their dashboards are and analyzed the tool for real-world performance.
1. LogFusion – Overall Best Log Monitoring Tools
Our tech team has put LogFusion in the top position as it is a desktop application that offers real-time log monitoring and analysis, primarily designed for system administrators, who need to keep track of growing or changing log files.
It offers a clean, efficient dashboard where logs (including plain text files, Windows Event Logs, or remote event channels) are displayed in real time.

It parses log lines and can split them into custom columns to help users read, analyze, and navigate more easily. It allows users to define Log Categories which remember settings like highlight rules or columns, making it faster to load similar log files. It also supports syncing highlight rules across devices (in the Pro version), which is helpful if you work on multiple systems.
Key Features
- Custom Row Highlighting (String or Regex): You can define highlighting rules based on simple text or powerful regular expressions. Matching log lines are colored/formatted, making it easy to spot errors, warnings, or any keyword pattern.
- Advanced Real-Time Text Filtering: As new log lines appear, you can filter them dynamically, hide lines that don’t match your query, or use complex search queries to zoom in on the relevant logs.
- Watched Folders: Instead of manually opening logs, you can set folders to be watched, whenever a new log file is created in one of those folders, LogFusion will automatically open it for you.
- Custom Column Parsing: LogFusion lets you split log lines into custom columns by defining parsing rules. This helps make logs more structured and readable, especially for logs that follow a repeatable format.
Plans
| Free Plan | Paid Plan (Starting Price & Basic Features) |
| Yes | $19 (LifeTime License per Machine) |
| Real-time log file monitoring & Exporting logs to CSV or HTML | Fully functional license including all LogFusion Pro features |
Pros & Cons
Pros
- Very lightweight and responsive for real-time monitoring
- Highly customizable highlighting and filtering
- Supports a variety of log sources (text + Windows Event logs)
Cons
- Free version misses some advanced features (like watched folders)
2. Papertrail (SolarWinds)– Best Log Monitoring Tools
Next tool, we’ve Papertrail, a cloud-hosted log-management solution that aggregates logs across applications, servers, devices and services into a single interface in minutes. It offers live tailing, lightning-fast search across multiple sources, and supports a wide variety of log types and formats, making it ideal for rapidly identifying issues and reducing time to resolution.
The dashboard is designed to be user-friendly. You get a unified search bar, filters by time, origin, text string, and the ability to drill into correlated events.

You can turn saved searches into alerts, visualize log velocity (patterns over time), and archive logs for compliance. The ease of setup and intuitive UI makes it accessible even for non-SSH or RDP-savvy users.
Key Features
- Live Tail & Real-time Search: Instantly tail logs across all senders, pause, search and scroll through live event streams, with filters like date, host, service, message contents, to spot issues as they happen.
- Log Velocity Analytics & Trend Visualization: Visualize event-volume trends over time (spikes or anomalies) and plot your queries into graphs to detect unusual behaviour or emerging problems.
- Unified Multi-Source Aggregation with Contextual Search: Checks logs from applications, network devices, cloud services, syslog, text logs, containers, then uses a single search bar or filters to correlate events across systems.
- Flexible Alerting & Archive Management: Create alerts from saved searches that trigger on new matches or inactivity, notify via email, Slack, webhooks & archive older logs with their own retention controls.
Plans
| Free Plan | Paid Plan (Starting Price & Basic Features) |
| Yes! | $7 per node per month |
| Live tailing, saved searches, dashboard visualisations (log velocity) and alerts | Unlimited systems/users for log senders and teams |
Pros & Cons
Pros
- One-place search across multiple log sources.
- Real-time tailing + analytics surface issues early.
Cons
- Pricing is usage-/volume-based, so heavy log volumes can become expensive.
3. Mezmo – Best Log Analysis Monitoring Tools
Now, we’ve Mezmo Log Monitoring (Log Analysis) that is built around an Active Telemetry paradigm, allowing teams to ingest, transform, and route log data in real time. It helps DevOps, SREs and developers to reduce noise, enrich data, and make smarter decisions by processing logs before storing them.
The platform provides live-tailing, in-stream alerts, and real-time analytics, giving you instant insight into your systems as logs are generated.

The user interface is designed to be intuitive and fast. Mezmo offers a simple query language, a searchable log viewer, boards and graph visualizations, and alerting capabilities like threshold or absence alerts. According to its documentation, users can set up dashboards, views, and alerts quickly and navigate logs with minimal friction.
Key Features
- Active Telemetry Pipeline: Mezmo’s Active Telemetry Pipeline processes logs while they are still in motion rather than after they’ve been stored, allowing teams to take action immediately.
- Live Tail with Tail-Based Sampling: The Live Tail provides a real-time streaming feed of all incoming logs, enabling engineers to debug issues the moment they occur.
- Data Profiling and Structure Discovery: This feature helps teams understand the true nature of their telemetry and decide which fields to index, optimize, or remove. By revealing which logs matter most, it guides smarter decisions about enrichment, storage, and routing.
- Dynamic, Responsive Pipelines: The pipelines automatically respond to operational changes such as traffic spikes, deployments or incident triggers. They intelligently adjust routing rules, apply retention controls, to maintain system stability and cost efficiency.
Plans
| Free Plan | Paid Plan (Starting Price & Basic Features) |
| 30-day free trial | $0.20 per GB ingested |
| Views & Alerts (via Slack, PagerDuty, etc.) | Unlimited Pipeline, Unlimited team members & multi-org support |
Pros & Cons
Pros
- Very Cost-Effective Tool
- Live Tail + responsive pipelines help with fast troubleshooting
- Can enrich, route, sample or drop logs in motion
Cons
- Short default retention for free plan
4. Sematext Logs – Centralised Log Monitoring Tools
Sematext’s log-monitoring tool is built to centralise logs from your infrastructure servers, VMs, containers (including Kubernetes), applications and more, into a single cloud service.
It supports shipping logs via many routes (like syslog, Elasticsearch-compatible shippers, agent-based) and gives you real-time visibility, rich search/filtering and correlation of logs with metrics and events.
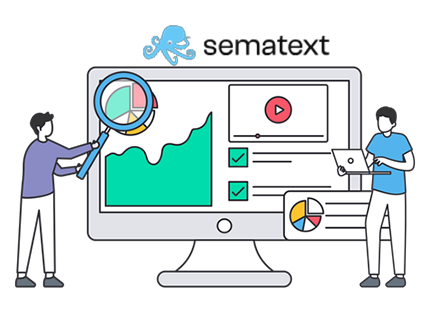
The dashboard is really very simple! you get full visualisations (pie charts & geolocation maps) plus live tailing of log streams, all from a single UI. It’s built to help DevOps/SRE teams spot issues faster, dig into root cause, set up alerts (threshold- or anomaly-based) and get notified before clients notice problems.
Key Features
- Automated Log Source Discovery & Shipping: It can automatically discover available services and log sources on hosts (via the agent) and enable shipping with minimal setup, reducing manual configuration of log ingestion.
- Log Pipelines for Structuring, Filtering & Dropping Logs: You can manage the structure of your logs via UI-based pipelines: extract meaningful fields, drop irrelevant log events, mask or transform data, which helps reduce noise and cost as well as improve clarity.
- Correlate Logs + Metrics + Events in One Platform: It allows you to visualise and correlate logs alongside metrics and events (in the same UI), enabling faster root-cause analysis across telemetry types.
- Rich Real-Time Dashboards + Live Tail: The UI supports live tailing of logs (in real time), plus dashboards built from custom components (time-series, top values, event counts) and you can compare two reports side-by-side.
Plans
| Free Plan | Paid Plan (Starting Price & Basic Features) |
| 14-day Free Trial | $5 per month |
| Access to core log search, dashboarding, live tail and integration capabilities | Increased daily log volume allowance beyond free tier |
Pros & Cons
Pros
- Very intuitive and responsive UI, easy for teams to get started.
- Strong ability to correlate logs, metrics and events in a unified platform rather than logs only.
Cons
- cost can increase significantly if you have very high log volumes
5. Sumo Logic – Cloud-Native Analysis And Log Monitoring Tools
Next, Sumo Logic offers a cloud-native log analytics and monitoring platform that collects log, event, metric and trace data from both cloud and on-premises systems to provide centralized visibility and faster issue resolution.
It indexes large-scale machine-generated data, uses built-in analytics and dashboards to help teams troubleshoot, detect threats and manage reliability across hybrid environments.

The dashboard and user interface are designed for ease-of-use with pre-configured dashboards for common platforms, language-like query capabilities and machine-learning-driven analytics. Users can view real-time insights, drill into issues and track KPIs via visualizations and alerts, which makes the user-experience relatively friendly compared to legacy log-management tools.
Key Features
- LogReduce and Outlier Detection: Reduces hundreds of thousands of log events into patterns and groups, filtering noise and helping identify root-causes faster.
- Unified Logs, Metrics & Traces: Combines logs, metrics and event traces into one platform with pre-built dashboards, enabling full-stack observability rather than just log aggregation.
- AI/ML-Driven Analytics & Search: Offers machine-learning capabilities such as anomaly detection, predictive analytics and everyday-language query support (via Mobot Query Agent) to speed up investigations.
- Cloud-Native, Multi-tenant Scalability with Broad Integrations: Built for large scale, supporting ingestion from cloud services (AWS, Azure), on-premises and hybrid, with hundreds of integrations so you can onboard quickly.
Plans
| Free Plan | Paid Plan (Starting Price & Basic Features) |
| Yes | Contact the Sales Team |
| Explore pre-built dashboards + Ability to ingest logs | Custom Pricing |
Pros & Cons
Pros
- Scales easily across cloud, on-prem and hybrid.
- Strong analytics and ML-driven features.
- Unified view of logs & traces improves visibility.
Cons
- Cost can rise with higher log-ingest volumes.
6. Datadog – All-in-One Log Monitoring Tools
The Datadog Log Management tool offers a modern, unified platform for collecting, monitoring and analysing logs at scale, seamlessly tying them to metrics and traces.
It enables teams to search, filter and explore log data on the fly without needing a custom query language, process and enrich logs centrally, and route or archive them based on value.
With an intuitive dashboard experience, users can build drag-and-drop analytics views, live-tail logs in real time, pivot from a log event directly to correlated APM traces or security alerts, and manage log volumes with cost-control in mind (index only key logs, archive the rest).
Key Features
- Unified log-metric-trace correlation: Logs, metrics and traces appear in one pane, so you can go from a log event into traces or metrics with a click and gain context effortlessly.
- Logging without Limits, storage model: You import all your logs, archive or index as needed and control retention and queryability independently, enabling cost-effective full coverage.
- Intuitive Log Explorer with pattern detection & live-tail: You get live-tailing of logs in real time, auto-tagging and pre-built facets for easy filtering. Log Patterns surface trends without manual log-file parsing.
- Rich processing, routing and security-compliance support: The pipelines for 200+ technologies, enrichment of logs, forwarding to third-party destinations, and advanced features like sensitive-data scanning, audit logs and SIEM-style analytics.
Plans
| Free Plan | Paid Plan (Starting Price & Basic Features) |
| Yes | Request a Demo (Premium Plan) |
| 14-day free trial + you can explore the full log management | Live-tailing, dashboards, pattern detection & anomaly detection |
Pros & Cons
Pros
- Logs, metrics & traces integrated.
- Drag & drop dashboards, minimal query language required.
- Scalable ingestion & flexible retention enables full coverage.
Cons
- Custom pricing is Costly
7. Dynatrace – AI-powered Log Monitoring Tools
What’s so special with Dynatrace’s Log Management & Analytics tool? See! It brings together logs, traces and metrics in a unified, real-time observability platform so that you can troubleshoot, monitor and analyse your application environments more effectively.
It automatically ingests log-data, enriches it with topology and context and surfaces problems and business insights via the built-in AI engine (Davis AI).
The dashboard is designed to be user-friendly! You get a single pane where logs, traces and metrics are correlated, and you don’t need to pre-define indexes or schemas because the system handles ingestion, enrichment and parsing automatically.
Key Features
- Unified observability of logs, traces & metrics: This feature enables logs, traces and metrics to be automatically correlated in context and in real time, so you don’t treat logs in isolation but as part of the full observability picture.
- Davis AI-driven root-cause and anomaly detection: Through Davis AI, the platform automatically detects anomalies, correlates events across logs, and surfaces problem cards with root-cause analysis, reducing manual investigation effort.
- Schema-free, on-read log analytics with metric extraction: You don’t need to define indexes or log schemas up front; you can ingest logs freely, extract metrics at ingest or on read and use the Dynatrace Query Language to analyse log data.
- Flexible cost & retention models with budget predictability: The tool offers two pricing models. Pay-per-query for maximum flexibility or a Retain with Included Queries model (predictable retention + unlimited queries) that helps manage cost.
Plans
| Free Plan | Paid Plan (Starting Price & Basic Features) |
| Yes | $0.20 per GiB |
| 15 days with no credit-card required | Ingest & Process + Allows Business intelligence extraction from logs |
Pros & Cons
Pros
- Davis AI for root-cause, anomaly detection reduces manual work.
- Schema-free ingestion and metrics extraction simplifies setup and flexibility.
- Flexible cost models help optimize budget.
Cons
- Minimum annual commitments and complexity of pricing
8. Splunk – Codeless Interface Log Monitoring Tools
Splunk Log Observer Connect enables organizations to bring logs from Splunk Cloud Platform or Splunk Enterprise into the observability workflow of the Splunk Observability Cloud, offering a unified, codeless interface for in-context troubleshooting.
It allows teams to correlate logs with real-time metrics and traces so that root causes and broader environmental impacts can be identified faster.

Users can point-and-click rather than write complex queries, filter by time, service, index, or other dimensions and view logs, metrics and traces side-by-side. This makes it accessible for IT teams, SRE and engineering DevOps teams who may not be deeply familiar with Splunk’s original search language, while still enabling advanced analysis when needed.
Key Features
- Codeless Log Queries in Observability Context: With this feature, you can query logs from Splunk Cloud directly in the observability interface. This removes friction in troubleshooting by allowing teams to stay in one pane of glass.
- Correlation of Logs with Metrics & Traces: The tool enables seamless analysis of logs in the context of associated metrics and traces, helping uncover root causes rather than just symptoms.
- Unified Platform for Multiple Teams & Use-Cases: By leveraging logs, metrics and traces in one platform, security, IT, DevOps and engineering teams access a common single source of truth, reducing tool fragmentation.
- Cost & Data Management Optimization: The platform supports index selection, aggregation and filtering of logs so you can centralize log data across teams and optimize storage and costs.
Plans
| Free Plan | Paid Plan (Starting Price & Basic Features) |
| Yes | $15 per host per month |
| 14 days, with no credit card required | includes Log Observer Connect |
Pros & Cons
Pros
- One unified platform for logs + metrics + traces.
- Very strong contextual troubleshooting
- Reduces tool sprawl and aligns multiple teams around one observability.
Cons
- Full feature set may have a learning curve for teams
9. Logstash – Open-Source Log Monitoring Tools
After Splunk, the best open-source server-side data-processing pipeline is Logstash that lets you ingest data from a wide variety of sources, apply transformations and filters and then send the results to your chosen stash for analysis and storage.
With a flexible pipeline model of inputs, Logstash helps centralise scattered log, metric and event data, convert it into structured form, and feed it into systems like elasticsearch for rich analytics.
From a user-experience standpoint, Logstash itself is more configuration-driven (via its DSL) than a GUI-based dashboard tool. While it supports monitoring of pipeline health, throughput, latency and processing via its integration with the Elastic Stack observability tools, the main interface remains the configuration files and logs rather than a fully polished “drag-and-drop” dashboard.
Key Features
- Extensive plugin architecture: Logstash supports over 200 input, filter and output plugins so you can mix and match sources, transforms and destinations as needed.
- Dynamic real-time transformation & enrichment: Data flows through a pipeline where filters like grok patterns, geo-IP lookups (deriving geo-coordinates from IPs), anonymising or dropping sensitive fields and data-type conversion are applied on the fly.
- Durability, fault-tolerance & scaling: Logstash supports persistent queues, dead letter queues, and at-least-once event delivery semantics, so that if nodes fail you still retain in-flight events and can replay them.
- Centralised pipeline management & monitoring: You can manage multiple pipelines from a single UI (Pipeline Management UI) and monitor performance, availability and bottlenecks across your deployment via pipeline viewer features.
Plans
| Free Plan | Paid Plan (Starting Price & Basic Features) |
| Yes | Request for Demo |
| Open-source input/filter/output pipeline functionality | Commercial support and service-level agreements (SLAs) |
Pros & Cons
Pros
- One-stop ingestion and routing pipeline for varied data sources.
- Vast plugin ecosystem enabling broad flexibility. Strong durability and fault-tolerance built-in.
Cons
- User interface focuses on configuration files
10. LogicMonitor – Infrastructure Log Monitoring Tools
Lastly, we’ve LM Logs too that are designed to turn traditional log management into full log intelligence.
It ingests log events from across an IT estate, enriches them with resource/alert/metric context, and then uses issues-detection and pattern analysis to highlight deviations and potential root causes rather than just storing logs.

Logs works by ingesting log data from many sources (on-prem, cloud, syslog, Windows events, Kubernetes, etc.), mapping the logs to monitored resources, applying enrichment and anomaly algorithms, and presenting the results via dashboards and search UIs.
Key Features
- Automatic Anomaly Detection of Log Events: LM Logs learns baseline patterns for each resource’s logs and flags new or unusual log events that deviate from that baseline. This means smaller issues or early-warning signs get surfaced rather than only reactive error alerts.
- Unified Correlation of Logs + Metrics + Alerts: Logs are not treated in isolation: LM Logs links log events to the monitored infrastructure resource, to metric-alerts, and to contextual metadata, all in one pane.
- Flexible Ingestion and Cost-Control via Routing & Filtering: The tool supports pre-ingestion filtering, routing, deduplication (via Cribl pipelines) so you don’t ingest everything, only what matters.
- Search, Filter, Visualise & Dashboard Logs (No Query Required for Many Use-Cases): For users who don’t want to master a query language, LM Logs offers intuitive filters, keyword search and UI-based drilldowns.
Plans
| Free Plan | Paid Plan (Starting Price & Basic Features) |
| Yes | $16 per hybrid unit |
| 14 Days Free access to the full platform | Full log ingestion from multiple sources |
Pros & Cons
Pros
- Rapid root-cause insights by correlating logs
- Flexible ingestion and cost-control (filtering & routing)
- Lower barrier to entry for non-query users.
Cons
- Pricing can become expensive for high log volume
What’s the difference between log management and log monitoring?
It’s very common for users to get confused between log management and log monitoring because both seem similar. But actually they are not the same. Below, we’ve explained the key differences in the simplest possible words through a short table.
| On What Basis? | Log Management | Log Monitoring |
| Purpose | Deals with collecting, storing, and organizing all logs. | Focuses on watching logs in real time to catch issues quickly. |
| Main Activity | Works mostly in the background, keeping logs safe and searchable. | Works actively, alerting you instantly when something unusual happens. |
| Usefulness | Helps you look back and understand past events or errors. | Helps you fix things immediately before they become big problems. |
| Data Handling | Manages huge log histories for long-term analysis. | Look only at current or recent logs for quick action. |
| Who needs it more? | Best for audits, compliance, and long investigations. | Best for daily operations, system health checks, and quick troubleshooting. |
Key Features to Look for in a Log Monitoring Tool
A random log monitoring tool can be really risky. What some third-party tools secretly do is that they track or record your system activities, putting your personal information in the wrong hands.
That’s why you must choose a safe tool. To help you make the right decision, here are the top features you should always check before selecting a log monitoring tool.
Real-Time Alerts
The tool should notify you instantly when there’s an error or suspicious activity. Fast alerts help you fix issues before they harm your system or business.
Easy-to-Use Dashboard
A simple dashboard makes it easy to understand what’s happening. Even beginners should be able to read logs, check graphs, and find problems quickly.
Strong Security & Privacy
The tool must protect your data and should never sell or misuse your logs. Look for encryption, compliance certifications, and transparent privacy policies.
Integration With Other Apps
It should connect smoothly with your servers, cloud apps, websites, and security tools. Better integration means smoother work and fewer manual tasks.
Scalability
Pick a tool that grows with your needs. Let’s say you have 10 logs or 10 million logs, it should handle everything without slowing down.
Advanced Search & Filtering
You should be able to find specific logs quickly. Good search features save time, especially when you’re trying to fix urgent issues.
Why Do You Need Log Monitoring Tools?
You need a log monitoring tool because it helps you keep your system safe and problem-free. Imagine your computer or server is like a busy classroom where many things happen at the same time.
A log monitoring tool acts like a helper that watches everything quietly and tells you if something is wrong.
- It tells you the errors, strange activities, or performance issues in simple words so you don’t get confused.
- It also helps you fix problems before they break your website, app, or system.
- Using a log monitoring tool means you don’t have to sit for hours checking logs.
- The tool does all the work for you. It saves you more time, protects your personal data and makes your tech life easier, even if you’re not a technical expert.
FAQ’s
Is ELK Stack better than Splunk?
Yes! ELK Stack is better than Splunk if you want full control and lower cost. ELK lets you customize everything and you don’t get locked into expensive pricing. It’s open-source, flexible and also it is good for teams that want deep visibility.
How does log monitoring improve security?
Log monitoring makes security much stronger because it instantly shows unusual activity that you would never notice manually. It lets you catch suspicious login attempts, errors, or system changes right when they happen. Instead of waiting for damage to occur, log monitoring gives you an early warning system.
Can log monitoring tools detect malware?
Yes! Good log monitoring tools can easily detect malware-like behavior. They recognize strange patterns, unknown processes, or abnormal traffic that normally happens during a malware attack. Even if the malware is new, the unusual activity stands out in the logs.
Are there open-source alternatives to Datadog?
Absolutely, yes! Open-source tools like ELK Stack, Prometheus and Grafana Loki are better choices if you want full control and zero vendor lock-in. These alternatives are powerful, customizable, and completely free. Datadog is good, but the costs add up quickly.
How much storage do log monitoring tools typically require?
Log monitoring tools usually need a lot of storage because logs grow nonstop. Even small systems can generate GB’s of data per day. This is why many people choose cloud storage or retention rules to manage it easily. With proper setup, you can keep only what matters and avoid storage overload.
Can I use log monitoring tools for cloud applications?
Yes! Log monitoring tools are OK for cloud applications. They’re built to track large, distributed systems in real time. Using them for cloud apps actually makes your monitoring simpler as compared to traditional setups.
How do I integrate log monitoring with alert systems like Slack or PagerDuty?
Integration is usually very easy because most log monitoring tools already come with built-in connectors for Slack, PagerDuty, Teams, email and more. You just configure the alert rules and plug in the integration once. After that, alerts flow automatically and your team gets notified instantly. It’s one of the simplest parts of log monitoring.
Which tool is best for small businesses?
For small businesses, open-source and lightweight tools like ELK Stack or LogFusion are the best. They’re affordable, easy to set up and don’t require a big team to manage. Paid enterprise tools like Splunk or Datadog can be too expensive and complex. Smaller free open source tools give small businesses everything they need without heavy cost.
Conclusion
Log monitoring tools make life so much easier! For beginners and also for the IT support teams, who want a simple and reliable way to track system issues.
Instead of manually reading endless log files, these tools help them quickly detect problems, understand errors and keep their systems running smoothly. Most tools are beginner-friendly, easy to set up and designed to make log monitoring stress-free even for those who are just starting.
In this blog, we’ve shared the top 10 best log monitoring tools, along with each provider’s features, free plans or free trials and starting prices. This gives you a clear and complete picture of what you can expect before choosing the right log monitoring software.
If you enjoyed this guide and want more helpful tech content, make sure to follow our page GoogieHost.com for the latest tech blogs and updates!
Comparative Table: Best Log Monitoring Tools 2025
To give you a quick and easy view of all the top tools, we created a simple table. It lists the top log monitoring tools, their unique features, and if they offer a free trial or not! All in easy one-line descriptions.
| Name of the Log Monitoring Tools | Type | Free Plan | Deployment | Best For |
| Log Fusion | Real-time log monitoring application for Windows. | Yes! Free version after trial. | Windows only (desktop/ local) | Developers/administrators |
| Papertrail (SolarWinds) | Cloud-hosted log management & monitoring. | Yes! There is a free plan. | Cloud (hosted) | Teams, who need fast setup and cloud-based log visibility. |
| Mezmo | Cloud log aggregation + real-time log analysis. | Yes! Free plan/community plan with limits. | Cloud-based. | DevOps & Teams working with containers |
| SemaText Logs | Cloud (and possibly hybrid) log monitoring + analytics. | Yes! Free tier available. | Cloud / hybrid (agent deployment) | Teams wanting logs + metrics + alerts |
| Sumo Logic | Unified logs & metrics & traces platform (cloud-native). | Free trial (and free tier with limits) | Cloud (SaaS) | Organizations needing scalable, enterprise-grade observability. |
| DataDog | Full observability (metrics, logs, traces) | Yes! | Cloud (SaaS) / hybrid agent-based | Companies wanting a single pane for metrics |
| Dynatrace | Full-stack monitoring | Free trial available (per cited blog) | Cloud or hybrid | Enterprises require auto-discovery and deep insight |
| Splunk | Large-scale log analytics & monitoring | Yes! Up to 500 MB per day for logs | On-premises + Cloud (hybrid) | Big companies with heavy log data |
| Logstash | Open-source log ingestion & processing engine | Free! It is an open-source tool | On-premises or self-hosted cloud | Teams comfortable with self-hosting |
| LogicMonitor | Infrastructure & application monitoring | Yes! | Cloud / hybrid monitoring | Companies needing unified infra+log monitoring |


![Best Free Cloud Hosting in [year] (Top 10 Proven Picks) 13 Best Free Cloud Hosting Provider](https://googiehost.com/blog/wp-content/uploads/2024/01/Best-Free-Cloud-Hosting-Provider-1024x576.jpg)
![21 Best Free WordPress Themes for Free Hosting in [year] (Hand Picked) 14 Best Free WordPress Themes](https://googiehost.com/blog/wp-content/uploads/2024/10/Best-Free-WordPress-Themes--1024x576.jpg)
![10 Best IT Infrastructure Monitoring Tools for [year] 15 Best IT Infrastructure Monitoring Tools](https://googiehost.com/blog/wp-content/uploads/2026/03/Best-IT-Infrastructure-Monitoring-Tools-1024x576.jpg)
![10 Best Remote Desktop Software ([year]): Fast & Secure Tools 16 Best Remote Desktop Software](https://googiehost.com/blog/wp-content/uploads/2026/03/Best-Remote-Desktop-Software-1024x576.jpg)