10 Best AWS Monitoring Tools in 2026 (Free + Paid, Tested)

If you’re running any real workload on Amazon Web Services, “check it later” is how a small CPU spike turns into a 2 AM outage call. AWS monitoring tools exist precisely to close that gap, giving you real-time visibility into performance, uptime, and cost before a small issue becomes a customer-facing one.
The challenge is that “AWS monitoring” now means dozens of tools spanning native AWS services, full-stack observability platforms, and budget-friendly open-source options, each with different pricing models and depth of AWS-specific integration.
We tested and compared the 10 Best AWS Monitoring Tools below, covering free options, budget picks, and enterprise-grade platforms, so you can match the right tool to your AWS environment instead of guessing.
Worth knowing: every tool below was researched and tested on its own merits. A couple of the outbound links here may be affiliate links that earn us a small commission, but that never changes the ranking order; placement is based purely on real features, pricing, and AWS integration depth.
What is an AWS Monitoring Tool?
An AWS monitoring tool is software that tracks, analyzes, and helps optimize your Amazon Web Services resources in real time, covering everything from EC2 uptime to Lambda invocation errors.
These tools give you complete visibility into your cloud infrastructure, including EC2 instances, S3 buckets, and Lambda functions. They help you monitor performance and ensure your AWS environment runs smoothly.
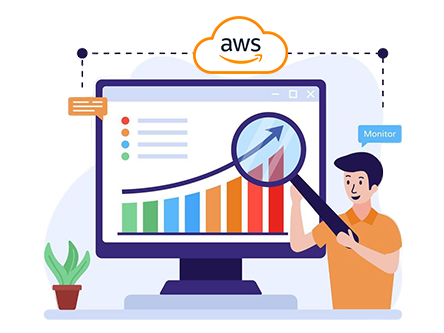
For DevOps engineers, system administrators, cloud architects, IT managers, and developers, these tools remove the need to manually check dozens of AWS service dashboards every day. DevOps teams automate alerts, system administrators track uptime, cloud architects optimize architecture performance, IT managers manage budgets, and developers debug applications faster, all from tools that collect data, visualize insights, and send alerts automatically.
10 Best AWS Monitoring Tools in 2026
Below are the top AWS Monitoring Tools we tested, with each one’s pricing, features, and standout strengths explained one by one.
⏰ TL;DR:
1. AWS CloudWatch – Overall Best AWS Monitoring Tool
2. Datadog – Best All-in-One AWS Monitoring Tool
3. New Relic – Best AWS Monitoring for Fast Setup
4. Dynatrace – Best AI-Powered AWS Monitoring Tool
5. Grafana Cloud – Best Agentless AWS Monitoring Tool
6. LogicMonitor – Best Hybrid & Multi-Cloud AWS Monitoring Tool
7. Site24x7 – Best AWS Cost & Uptime Monitoring Tool
8. Sematext Cloud – Best Budget AWS Monitoring Tool
9. Better Stack – Best Modern AWS Uptime & Incident Monitoring Tool
10. Zabbix – Best Free & Open-Source AWS Monitoring Tool
1. AWS CloudWatch – Overall Best AWS Monitoring Tool
AWS CloudWatch

Pros
- Integrates deeply with AWS and other clouds
- Customizable dashboards and visualizations
- Genuinely usable free tier for small projects
Cons
- Pricing can increase quickly for large-scale data and log usage
- Limited multi-cloud support compared to third-party tools
Summary
AWS CloudWatch is Amazon’s native monitoring service, offering end-to-end observability, smart alerting, and a genuinely useful free tier for tracking AWS resources in real time.
Amazon CloudWatch is AWS’s own monitoring and observability service, built directly into the platform so there’s no separate account or agent needed to start tracking your resources.
It collects and analyzes data from metrics, logs, and events, giving you a unified dashboard to understand system-wide performance, and its interface stays approachable even for non-technical users through customizable dashboards, charts, and alarms.
CloudWatch also offers a genuinely usable Free Tier that includes 10 custom metrics and alarms, making it an excellent starting point for small projects or anyone just getting familiar with AWS monitoring.
Key Features
- End-to-End Observability: Get a complete view of AWS, on-premises, and hybrid resources in one place, so you can analyze logs, metrics, and traces together for faster issue resolution.
- Smart Automation and Alerts: Set alarms and automated responses based on custom thresholds or machine learning predictions, helping minimize downtime without needing to babysit dashboards manually.
- Logs Insights and Analytics: Query and analyze logs instantly with CloudWatch Logs Insights, helping you identify root causes and trends within your data in seconds instead of hours.
- Internet and Application Monitoring: CloudWatch Internet Monitor and Application Insights detect outages and monitor latency, helping ensure smooth website and app performance for end users.
- Native, Zero-Agent Setup: Because CloudWatch is built into AWS itself, there’s no separate agent to install or third-party account to configure before you start seeing data.
- Custom Dashboards & Widgets: Build dashboards from scratch using widgets for metrics, logs, alarms, and text, tailoring the view to exactly what your team checks most often.
- Cross-Account & Cross-Region Views: CloudWatch supports monitoring across multiple AWS accounts and regions from a single dashboard, useful once your infrastructure grows past one region.
Pricing
| Free Tier | Pay-as-you-go | Logs & Insights |
|---|---|---|
| 10 custom metrics & alarms | $0.30 per custom metric/mo | Priced per GB ingested |
CloudWatch’s free tier covers basic monitoring needs; costs scale with the number of custom metrics, alarms, and log volume you actually use.
Best For
CloudWatch is the natural starting point for app developers, IT operations managers, and data analysts who are already fully invested in AWS and don’t need multi-cloud support.
AWS Integration Depth
Since CloudWatch is Amazon’s own service, it has the deepest and most immediate integration with every new AWS feature, often before third-party tools catch up.
2. Datadog – Best All-in-One AWS Monitoring Tool
Datadog

Pros
- Very quick setup and intuitive for AWS-centric environments
- Broad pre-built integrations (100+ AWS services)
- Strong for both ops and security teams in one platform
Cons
- Pricing can escalate rapidly as more hosts are added
- Per-host billing can get expensive for large fleets
Summary
Datadog centralizes visibility across your AWS environment by collecting metrics, logs, and events from 100+ AWS services into one unified, fast-to-deploy platform.
Price: USD 15 /month
Visit DatadogDatadog for AWS monitoring centralizes the visibility of your entire AWS environment by collecting metrics, logs, and events from dozens of AWS services and displaying them in one unified platform.
It supports multi-account and multi-region deployments, and you can spin the integration up in minutes via a one-click setup or CloudFormation template, so there’s minimal delay between signing up and seeing real data.
Beyond basic infrastructure metrics, it also enables security monitoring, cost visibility, and migration tracking across AWS workloads, helping teams proactively catch performance issues and control cloud spend.
Key Features
- One-Click AWS Integration: Install via AWS Organizations or Control Tower for instant aggregated visibility across all your AWS accounts and regions without manual per-account setup.
- Deep Service & Serverless Coverage: Datadog auto-discovers AWS services like Lambda and ECS, and integrates with hosts via its Agent for granular metrics like memory usage or disk latency.
- Cloud Cost Management: Correlate infrastructure cost directly with performance metrics, making it easier to spot exactly where overspend lines up with underperforming resources.
- Unified Hybrid Observability: Service Maps combine on-premises, AWS, and other cloud resources into one topology view, useful for teams mid-migration or running hybrid infrastructure.
- Security Monitoring Built In: Datadog layers security monitoring on top of standard observability, so suspicious activity surfaces in the same dashboards your ops team already checks daily.
- 100+ Pre-Built Integrations: Beyond AWS, Datadog connects with dozens of other tools out of the box, reducing the custom glue code needed to pull data from your existing stack.
- Real User & Synthetic Monitoring: Track actual user experience alongside synthetic checks, giving a fuller picture of performance than infrastructure metrics alone can provide.
Pricing
| Free | Pro | Enterprise |
|---|---|---|
| 14-day full-feature trial | $15 per host/month | Custom pricing |
Datadog’s per-host pricing model means costs scale directly with your infrastructure size, so it’s worth estimating host count before committing.
Best For
Datadog suits start-ups building on AWS, enterprises mid-migration, and teams that need both DevOps and security visibility inside a single platform.
Setup Time
Most teams report onboarding AWS monitoring in well under an hour thanks to the one-click integration, a real advantage if you need visibility fast.
3. New Relic – Best AWS Monitoring for Fast Setup
New Relic

Pros
- Real-time AWS metric streaming
- Quick setup with minimal configuration
- Supports over 50 AWS services
Cons
- Limited customization in free dashboards
- Advanced features require moving to paid tiers
Summary
New Relic uses CloudWatch Metric Streams to collect and visualize AWS metrics from 50+ services in minutes, backed by a genuinely generous free data-ingest tier.
Price: USD 49 /month
Visit New RelicNew Relic’s AWS monitoring is powered by Amazon CloudWatch Metric Streams, letting you seamlessly collect and visualize AWS metrics from multiple services in one place without juggling separate integrations.
It simplifies monitoring by using a single integration point through CloudWatch, making it faster to analyze application performance and infrastructure health, and setup itself is refreshingly simple: sign up, connect your AWS account, and pre-built dashboards appear instantly.
With its free plan and deep integration capabilities, New Relic is ideal for businesses that want real-time visibility without complicated configuration, and it supports monitoring for more than 50 AWS services out of the box.
Key Features
- AWS Metric Stream Integration: Collects all AWS metrics and custom namespaces via Amazon CloudWatch, ensuring real-time, accurate data flow to New Relic with minimal setup effort.
- Pre-Built Dashboards & Alerts: Out-of-the-box dashboards and alert systems instantly visualize performance metrics and notify teams of issues without any manual dashboard building.
- Cross-Service Visibility: Monitor more than 50 AWS services from one account, giving teams complete transparency across their entire AWS ecosystem in a single pane of glass.
- Ease of Setup & Automation: The integration requires only a few clicks: sign up, connect, and start monitoring, making it one of the simplest AWS tools to deploy from scratch.
- Generous Free Data Ingest: The free tier includes 100 GB per month of data ingest plus alerting features, enough for many small-to-mid-sized projects to run without paying anything.
- Full-Stack APM Beyond AWS: New Relic’s application performance monitoring extends beyond infrastructure metrics into code-level tracing, useful once you need to debug slow requests.
- Unified Query Language (NRQL): NRQL lets you query across metrics, logs, and traces with a single SQL-like syntax, reducing the need to learn multiple separate query languages.
Pricing
| Free | Standard | Pro/Enterprise |
|---|---|---|
| 100GB/mo data ingest included | $49/month | Custom pricing |
New Relic’s usage-based pricing on data ingest makes it predictable for smaller projects but worth monitoring closely as data volume grows.
Best For
New Relic fits developers, DevOps engineers, and cloud architects who want real-time AWS visibility without spending days on configuration.
Free Tier Depth
The 100GB/month free data allowance is genuinely usable for small production workloads, not just a token trial like some competitors offer.
4. Dynatrace – Best AI-Powered AWS Monitoring Tool
Dynatrace

Pros
- Extremely easy to deploy and use with auto-instrumentation
- Provides AI-driven, real-time root cause analysis
- Integrates natively with 100+ AWS services
Cons
- Advanced features can be expensive for small teams
- Per-host-hour pricing requires careful capacity planning
Summary
Dynatrace pairs AI-driven root cause analysis with full-stack auto-instrumentation, detecting AWS anomalies and fixing them faster than manual dashboard-checking ever could.
Price: USD 0.04 /month
Visit DynatraceDynatrace is an AI-powered observability and analytics platform built for both cloud-first and hybrid environments, providing complete visibility across AWS infrastructure while helping teams comply with the AWS Well-Architected Framework.
With automated setup and a unified dashboard, it simplifies AWS monitoring by automatically collecting metrics, logs, and traces without manual configuration, and its auto-instrumentation feature gets most teams up and running in under five minutes.
The platform’s Davis AI engine detects issues, identifies root causes, and provides predictive analytics to prevent future problems, which translates into reduced mean time to resolution and more proactive incident management overall.
Key Features
- AI-Powered Root Cause Analysis: Davis AI automatically identifies anomalies, pinpoints the root cause of incidents, and suggests resolutions without manual setup, saving real investigation time.
- Full-Stack Auto-Instrumentation: Dynatrace’s OneAgent pulls data from AWS and traditional systems without code changes, offering complete visibility from infrastructure up to user experience.
- Predictive Analytics & Auto-Baselining: The tool learns normal performance boundaries using built-in machine learning, predicting and preventing issues before they impact business operations.
- Built-In SLO Management: Site Reliability Guardian helps teams define SLOs, assess change impact, and automate rollbacks or fixes using causal AI workflows instead of manual runbooks.
- Under-5-Minute Setup: Seamless integration and auto-instrumentation mean most teams are fully monitoring their AWS environment in under five minutes from account connection.
- 100+ Native AWS Integrations: Dynatrace integrates natively with over 100 AWS services, reducing the custom configuration typically needed to cover a full AWS footprint.
- Unified Security & Observability: Runtime vulnerability detection sits alongside standard observability data, so security findings appear in the same context as performance issues.
Pricing
| Free | Paid | Enterprise |
|---|---|---|
| Full features, limited period | $0.04 per host/hour | Custom pricing |
Dynatrace’s per-host-hour billing rewards precise host sizing; overprovisioned hosts quietly inflate the monthly bill more than with flat-rate competitors.
Best For
Dynatrace is best suited to AWS administrators, performance monitoring teams, and enterprises managing hybrid or multi-cloud environments at scale.
AI Automation Depth
Davis AI’s automated root cause analysis is genuinely more advanced than most competitors’ anomaly detection, which is Dynatrace’s clearest differentiator.
5. Grafana Cloud – Best Agentless AWS Monitoring Tool
Grafana Cloud

Pros
- Easy, no-code AWS integration
- Unified monitoring for 60+ AWS services
- Cost control through configurable metrics
Cons
- Advanced enterprise analytics require paid plans
- Some dashboards need tuning to match specific team needs
Summary
Grafana Cloud’s AWS Observability app monitors 60+ AWS services with an agentless setup, unified dashboards, and a genuinely usable free tier for small teams.
Price: USD 49 /month
Visit Grafana CloudGrafana Cloud’s AWS Observability app is an all-in-one solution for visualizing and monitoring over 60 Amazon Web Services resources like EC2, RDS, Lambda, and CloudFront from a single connected account.
It offers a quick, agentless setup that lets users connect their AWS accounts to Grafana Cloud within minutes, streaming metrics and logs securely without complex instrumentation or extra software to maintain.
Its intuitive dashboards, centralized log view, and customizable metric scrapes make AWS monitoring seamless and cost-efficient, and the free plan is genuinely usable for small teams or early-stage projects monitoring basic AWS applications.
Key Features
- Agentless, Fast Setup: Connect your AWS resources directly to Grafana Cloud with no local agents to install; the entire setup process takes just a few clicks.
- Unified Metrics & Logs Dashboard: Monitor metrics and logs from 60+ AWS services in one unified interface, providing deep insights across EC2, Lambda, and more without switching tools.
- Smart Cost Control & Metrics Filtering: Customize exactly which AWS metrics to pull and how often, helping control storage, data usage, and cost efficiency with real precision.
- Prebuilt Dashboards & Log View: Access dozens of ready-to-use AWS dashboards and explore all service logs in one place, speeding up root cause analysis significantly.
- Built on Open-Source Grafana: Grafana Cloud is built on the widely-used open-source Grafana project, so skills and dashboards transfer easily if your team already knows the tool.
- Flexible Multi-Cloud Support: Beyond AWS, Grafana Cloud monitors Azure and GCP resources too, useful if your infrastructure isn’t purely AWS-based.
- Alerting Across Data Sources: Unified alerting works across metrics, logs, and traces regardless of source, reducing the number of separate alerting systems your team has to maintain.
Pricing
| Free | Pro | Enterprise |
|---|---|---|
| Limited-scale AWS dashboards | $49/month | Custom pricing |
Grafana Cloud’s free tier is genuinely usable for small projects, with paid tiers unlocking multi-account monitoring and custom alerts.
Best For
Grafana Cloud works well for infrastructure teams, cloud-native startups, and enterprise operations teams already comfortable with Grafana dashboards.
Open-Source Advantage
Because it’s built on open-source Grafana, migrating away later or self-hosting a hybrid setup is far easier than with closed-source competitors.
6. LogicMonitor – Best Hybrid & Multi-Cloud AWS Monitoring Tool
LogicMonitor

Pros
- Brings hybrid and cloud into one platform
- Many organizations onboard AWS monitoring in under an hour
- Advanced AIOps cuts alert noise and focuses on meaningful issues
Cons
- Pricing and licensing can be less transparent
- Hybrid Unit model takes some getting used to for cost planning
Summary
LogicMonitor LM Envision extends CloudWatch visibility into hybrid infrastructures, unifying AWS, on-premises, and multi-cloud monitoring with strong AIOps-driven alert grouping.
Price: USD 16 /month
Visit LogicMonitorLogicMonitor LM Envision is a comprehensive observability platform designed to extend the visibility of Amazon CloudWatch into hybrid infrastructures, spanning AWS, on-premises, and multi-cloud environments in one place.
It enables organizations to monitor AWS resources alongside legacy data-center and hybrid systems in a unified view, helping ensure infrastructure health, service availability, and migration success with more confidence.
Setup is fast and streamlined: you link your AWS account via IAM roles or APIs, select the services you want to monitor, and auto-discovery begins right away without needing to manually map every resource.
Key Features
- Native AWS Service Integration: LM Envision integrates with 70+ AWS services and automatically detects new resources, keeping monitoring in step with your cloud deployments.
- Intelligent Alert Grouping: Alerts from related AWS resources are automatically clustered into meaningful incidents, enriched with severity, resource relationships, and impact context.
- Consolidated Hybrid Visibility: Service Maps and combined views of on-premises, AWS, and other clouds like Azure or GCP give you a full topology of your environment in one screen.
- Automated Baseline & Anomaly Detection: Dynamic baselining via time-series learning detects abnormal behavior automatically, flagging drift from expected performance without manual thresholds.
- Under-an-Hour Onboarding: Many organizations report onboarding AWS monitoring in under an hour, a meaningful advantage for teams that can’t dedicate days to setup.
- Strong MSP-Friendly Multi-Tenancy: Built-in support for managing multiple customer environments makes LM Envision a natural fit for managed service providers juggling several AWS accounts.
- Customizable Dashboards & Reports: Build role-specific dashboards and scheduled reports, so different stakeholders see exactly the AWS data relevant to their responsibilities.
Pricing
| Free Trial | Paid | Enterprise |
|---|---|---|
| 15-day full-platform access | $16 per Hybrid Unit/month | Custom pricing |
LogicMonitor’s Hybrid Unit pricing model scales with the resources you monitor, which can make cost estimation less straightforward than flat per-host pricing.
Best For
LogicMonitor is a strong fit for organizations migrating VMware workloads to AWS and MSPs managing multiple tenant hybrid customer environments.
AIOps & Alert Noise Reduction
The advanced AIOps engine genuinely cuts alert noise compared to simpler threshold-based tools, letting teams focus on issues that actually matter.
7. Site24x7 – Best AWS Cost & Uptime Monitoring Tool
Site24x7

Pros
- Unified monitoring for 80+ AWS services
- AI-based predictions and anomaly detection
- Simple setup with auto-discovery
Cons
- Advanced automation options require higher-tier plans
- Interface can feel dense for first-time users
Summary
Site24x7 unifies uptime, performance, and cost monitoring across 80+ AWS services with AI-driven anomaly detection and automated incident remediation built in.
Price: USD 9 /month
Visit Site24x7Site24x7 AWS Monitoring offers a unified platform to monitor uptime, performance, and costs across all your AWS services, built for enterprises and MSPs that need AI-driven insights and proactive anomaly detection.
With support for 80+ AWS services, it brings together logs, metrics, and traces into one intuitive dashboard for faster troubleshooting, and setup is seamless: connect your AWS account, and Site24x7 auto-discovers resources for instant monitoring.
The tool also supports cost visualization and forecasting, helping predict future spending trends while keeping your AWS budget under control, backed by customizable reports and automation aimed at improving overall reliability.
Key Features
- AI-Powered Anomaly Detection: Machine learning detects unusual behavior in metrics, forecasting potential performance issues and alerting teams before they actually impact users.
- Automated Incident Remediation: Automate repetitive AWS tasks like restarting EC2 instances or stopping idle RDS databases in response to incidents, cutting manual response time.
- Comprehensive Inventory Dashboard: Get a real-time overview of all AWS resources, compare weekly usage trends, and identify scaling patterns or underutilized assets effortlessly.
- Integrated Cost and Usage Analytics: Visualize AWS spending, allocate budgets, and optimize costs using built-in analysis tools that consolidate billing data with performance metrics.
- Uptime Monitoring from Global Locations: Beyond infrastructure metrics, Site24x7 checks uptime from multiple global locations, catching regional outages that AWS-only tools might miss.
- 80+ AWS Service Coverage: Broad native coverage across compute, storage, database, and networking services means fewer gaps in visibility across a typical AWS footprint.
- MSP-Ready Multi-Client Views: Built-in support for managing multiple client AWS accounts makes Site24x7 a practical choice for agencies and managed service providers.
Pricing
| Free Trial | Starter | Enterprise |
|---|---|---|
| 30-day full-featured trial | $9/month | Custom pricing |
Site24x7’s entry price is one of the lowest on this list, making it an accessible option for smaller teams needing broad AWS coverage.
Best For
Site24x7 suits cloud architects, MSPs, and DevOps engineers who want uptime, performance, and cost visibility bundled into a single affordable platform.
Cost Forecasting Value
The built-in cost visualization and forecasting tools go further than most competitors here, directly addressing AWS budget-overrun concerns.
8. Sematext Cloud – Best Budget AWS Monitoring Tool
Sematext Cloud

Pros
- Significantly cheaper than Datadog or New Relic for similar coverage
- 14-day trial with no credit card required
- Unified platform covers infra, logs, and APM together
Cons
- Smaller integration ecosystem than the largest competitors
- Less brand recognition than Datadog or Dynatrace
Summary
Sematext Cloud delivers unified AWS infrastructure, log, and application monitoring at roughly a quarter of the cost of larger competitors like Datadog.
Price: USD 9 /month
Visit Sematext CloudSematext Cloud is a unified observability platform combining infrastructure monitoring, application performance monitoring, log management, real user monitoring, and synthetic monitoring in a single account.
It includes over 100 built-in integrations with automatic service discovery for Docker, Kubernetes, AWS, and JVM environments, plus specific coverage for AWS services including Lambda, ECS, and CloudWatch.
The clearest differentiator is price: Sematext delivers comparable observability at roughly 25% the cost of market leaders like Datadog, and is reported to run 4-5 times cheaper than New Relic APM for similar workloads.
Key Features
- Unified Observability Platform: Infrastructure monitoring, APM, logs, real user monitoring, and synthetics all live in one account, reducing the tool sprawl many teams accumulate over time.
- 100+ Built-In Integrations: Automatic service discovery covers Docker, Kubernetes, AWS, and JVM environments out of the box, cutting down on manual integration configuration.
- AWS Lambda, ECS & CloudWatch Coverage: Native support for core AWS services means serverless and container-based AWS workloads get monitored without extra third-party glue.
- Significantly Lower Cost Than Rivals: Sematext is reported to cost roughly 25% of Datadog and 4-5 times less than New Relic APM for comparable observability coverage.
- 14-Day No-Card-Required Trial: The free trial requires no credit card upfront, making it low-friction to test against your actual AWS workload before committing.
- Log Management Built In: Centralized log management is included rather than sold as a separate add-on product, simplifying the overall pricing structure.
- Synthetic Monitoring Included: Pay-as-you-go synthetic HTTP monitoring lets you check endpoint availability without committing to a full-priced uptime monitoring plan.
Pricing
| Free | Startup | Standard |
|---|---|---|
| Free tier available | $9/month | From $19-50/month by module |
Sematext prices each module (logs, synthetics, experience) somewhat independently, so total cost depends on which combination of features you actually need.
Best For
Sematext is a strong fit for budget-conscious teams and startups that want Datadog-like observability without the enterprise-level price tag.
Value for Money
At roughly a quarter of Datadog’s typical cost for comparable coverage, Sematext is one of the more cost-effective full-featured options on this list.
9. Better Stack – Best Modern AWS Uptime & Incident Monitoring Tool
Better Stack

Pros
- Genuinely usable free tier, not just a trial
- Modular pricing avoids paying for unused features
- 60-day money-back guarantee
Cons
- Less AWS-native depth than CloudWatch or Datadog
- Newer platform with a smaller long-term track record
Summary
Better Stack combines uptime monitoring, log management, and AI-assisted incident response in a modular, pay-for-what-you-use platform with a genuinely free entry tier.
Price: USD 24 /month
Visit Better StackBetter Stack takes a modular approach to AWS monitoring, pricing uptime monitoring, log management, incident management, tracing, and infrastructure monitoring independently, so teams pay only for what they actually use.
The free tier includes 10 monitors with 3-minute check intervals and one phone call alert, making it a genuinely viable option for small projects rather than just a crippled trial version.
Its AI SRE features handle automated root cause analysis and AI-written postmortems, and its uptime monitoring checks run every 30 seconds from multiple global locations with confirmation from a second location before alerting, cutting down on false-positive pages.
Key Features
- Modular, Pay-Per-Product Pricing: Uptime monitoring, logs, incidents, and infrastructure monitoring are priced separately, so you’re never forced into an all-in-one bundle you don’t need.
- AI-Assisted Root Cause Analysis: AI SRE features write automated postmortems and help pinpoint root causes, reducing the manual investigation work after an incident occurs.
- Multi-Location Uptime Checks: Checks run every 30 seconds from multiple global locations, with confirmation from a second location before alerting to eliminate false positives.
- Genuinely Usable Free Tier: 10 monitors with 3-minute checks and phone call alerting are included free, enough to actually run monitoring for a small site or side project.
- Wide Integration Ecosystem: Connects with Slack, MS Teams, Zapier, Terraform, Jira, Notion, Sentry, Datadog, Grafana, and more, fitting into most existing engineering workflows.
- Unified Logs, Metrics & Uptime: Full-stack observability combines logs, metrics, and uptime monitoring in one platform rather than requiring separate tools stitched together.
- 60-Day Money-Back Guarantee: A 60-day money-back guarantee is notably longer than most monitoring tools offer, giving teams real time to validate fit before committing.
Pricing
| Free | Uptime & Incidents | Logs & Dashboards |
|---|---|---|
| 10 monitors, 3-min checks | $29/month | $24/month |
Because pricing is modular, your actual monthly cost depends heavily on which combination of uptime, logs, and incident features you enable.
Best For
Better Stack fits teams that want modern, modular observability without committing to a single expensive all-in-one platform upfront.
Money-Back Guarantee
The 60-day guarantee is among the longest in this list, meaningfully lowering the risk of testing it against real AWS production traffic.
10. Zabbix – Best Free & Open-Source AWS Monitoring Tool
Zabbix

Pros
- Completely free with no per-host or per-metric charges
- Full control over data retention and customization
- Official AWS CloudWatch templates included
Cons
- Requires self-hosting and ongoing server maintenance
- Steeper learning curve than most SaaS competitors
Summary
Zabbix is a completely free, open-source monitoring platform with official AWS templates, making it the go-to choice for teams that want zero licensing costs.
Zabbix stands apart from every other tool on this list by being entirely free and open-source, with no per-host or per-metric charges regardless of how large your AWS environment grows.
It ships with official templates for monitoring core AWS services, including EC2, RDS, and Lambda via CloudWatch data collection, so you’re not starting from a completely blank configuration.
Because it’s a self-hosted open-source monitoring tool, you get full control over data retention, customization, and where your monitoring data actually lives, at the cost of needing to manage the Zabbix server infrastructure yourself.
Key Features
- Completely Free & Open-Source: There’s no license fee at any scale; the only cost is the infrastructure you run Zabbix on yourself, making it uniquely budget-friendly for large deployments.
- Official AWS CloudWatch Templates: Pre-built templates pull CloudWatch data for EC2, RDS, Lambda, and other core services, reducing the initial configuration workload.
- Full Data Ownership & Retention Control: Since you self-host Zabbix, you control exactly how long monitoring data is retained, unlike SaaS tools with fixed retention windows.
- Flexible Alerting & Escalation: Highly configurable alerting supports complex escalation chains and multiple notification channels, tunable well beyond simple threshold alerts.
- Custom Scripts & Extensibility: Zabbix supports custom scripts and external checks, letting technical teams monitor anything CloudWatch doesn’t cover natively out of the box.
- No Per-Metric or Per-Host Billing: Unlike nearly every other tool on this list, adding more hosts or metrics never increases your monthly bill since there isn’t one.
- Active Open-Source Community: A long-running, active community and extensive documentation help fill gaps that official support might not cover as quickly as paid tools.
Pricing
| Community | Technical Support | Zabbix Cloud |
|---|---|---|
| Free, self-hosted | Paid support plans available | Managed hosting option |
Zabbix itself is free forever; your only real cost is the server you host it on, or an optional paid support/managed hosting plan from Zabbix itself.
Best For
Zabbix is ideal for technical teams with the skills to self-host, and for organizations that want to avoid recurring per-host monitoring fees entirely.
Self-Hosting Trade-Off
The zero licensing cost comes with a real trade-off: your team is responsible for maintaining, scaling, and securing the Zabbix server itself.
Best Free AWS Monitoring Tools
If budget is the main constraint, four tools from this list stand out for genuinely usable free options rather than crippled trials:
- AWS CloudWatch – The free tier includes 10 custom metrics and alarms at no cost, and it’s the only option with zero setup since it’s already built into your AWS account.
- Zabbix – Completely free and open-source with no per-host or per-metric charges ever, though you’re responsible for hosting and maintaining the server yourself.
- Grafana Cloud – The free plan covers limited-scale AWS applications with prebuilt dashboards, a solid choice for small projects and early-stage startups.
- Better Stack – The free tier includes 10 real monitors with 3-minute checks and phone call alerting, genuinely usable rather than a time-limited trial.
Once your AWS environment outgrows these free tiers, that’s usually the signal to move to a paid plan on the same tool rather than switching platforms entirely.
Factors to Consider When Choosing an AWS Monitoring Tool
Here, we’re going to help you choose the best AWS monitoring tool for your specific use case. For example, if you want to monitor EC2 instance performance and set automated alerts for downtime, you’ll need a tool that offers robust performance metrics and customizable notifications.
To help you decide wisely, we’ve listed the top 5 factors you should consider before making your choice.
- Ease of Use: Look for a tool with a simple interface and an intuitive dashboard. The easier it’s to navigate, the faster your team can adapt without extensive training.
- Integration Capabilities: The best AWS monitoring tool integrates seamlessly with services like CloudWatch, SNS, or third-party platforms like Slack. This ensures a smooth workflow without switching between tools.
- Customization and Alerts: Choose a tool that lets you set personalized alerts, dashboards, and performance thresholds. Customization ensures you get notified about what matters most to your operations.
- Scalability: As your business grows, your monitoring tool should scale with it. Look for solutions that can handle multiple AWS accounts, regions, and workloads efficiently.
- Pricing and Free Trial Options: Always check if the tool offers a free AWS monitoring plan or trial. This helps you test its functionality before committing to a paid plan.
How to Set Up AWS Monitoring (Step-by-Step Guide)?
Ready to get started? In this section, we’ll walk you through how to set up an AWS monitoring tool from scratch. Even if you’re new to AWS, don’t worry! We’ll make this step-by-step guide easy to follow. By the end, you’ll know exactly how to start monitoring your cloud infrastructure like a pro. Let’s dive in!
Step 1: Log in to Your AWS Management Console >> Access your AWS account and ensure you have the necessary IAM permissions to monitor resources.
Step 2: Navigate to the CloudWatch Dashboard >> Go to the AWS Management Console >> “Services” >> search for “CloudWatch.”
Step 3: Set Up Metrics and Dashboards >> Choose the AWS service you want to monitor (EC2, S3, RDS) >> Create a dashboard to visualize key metrics such as CPU usage, latency and disk I/O.
Step 4: Create Alarms and Notifications >> Set thresholds for critical metrics and configure alarms >> Then, connect CloudWatch to Amazon SNS to receive email or SMS notifications.
Step 5: Enable Logging and Insights >> Activate AWS CloudTrail for deeper insights into user activity and network traffic.
Step 6: Integrate with Third-Party Tools (Now this is an optional step) >> You can enhance monitoring by connecting CloudWatch with third-party AWS monitoring tools like Datadog / New Relic for advanced analytics.
Step 7: Test and Optimize >> Run a few tests to ensure your alerts and dashboards are working correctly >> Adjust thresholds and visualizations as needed.
What are some Common AWS Monitoring Challenges?
If you’re a newbie to AWS monitoring, you might face a few bumps along the way and that happens to be totally normal! In this section, we’ll highlight some of the most common challenges users encounter when using an AWS monitoring tool and explain how you can overcome them effectively.
- Overwhelming Data Volume: AWS produces tons of metrics. Use dashboards and filters to focus on what’s important instead of tracking everything.
- Alert Fatigue: Too many alerts can be stressful. Set threshold-based alerts and use automation to suppress low-priority notifications.
- Complex Configuration: Some tools can be tricky to set up. Follow official documentation and use AWS CloudFormation templates to simplify deployment.
- Cost Management: Continuous monitoring can add up in costs. Use Free AWS monitoring tools or set budget alerts in AWS Cost Explorer to control expenses.
- Integration Difficulties: Not all tools integrate easily with third-party platforms. Choose tools that support native integrations and APIs for smooth connectivity.
What’s the Difference Between CloudWatch and Third-Party Tools?
In this section, we’ll break down the difference between AWS CloudWatch and third-party AWS monitoring tools. Understanding these distinctions will help you decide which solution fits your organization best.
| CloudWatch | 3rd-Party Tools |
|---|---|
| native to AWS | external solutions with added functionalities |
| focuses on AWS services only | offer multi-cloud support |
| Get a basic dashboards | Visualization and reporting are good |
| relies on manual configurations | provide AI-based insights |
| more affordable | can be pricier |
FAQs
What is the best free AWS monitoring tool?
The best free AWS monitoring tool is Amazon CloudWatch. It’s built right into AWS, easy to use, and doesn’t require extra setup. Even with its free tier, CloudWatch gives you powerful insights into your resources, like EC2 instance performance to application logs.
Is AWS CloudWatch enough for monitoring all AWS services?
Yes, AWS CloudWatch is more than enough for monitoring all AWS services. It’s designed specifically by AWS to cover the entire ecosystem like EC2, S3, Lambda, RDS, DynamoDB, and more. You can track metrics, set alarms, visualize performance, and even automate responses to changes.
Can Datadog monitor non-AWS services?
Yes, Datadog can monitor non-AWS services, and that’s one of its strongest points. It’s a cloud-based monitoring tool that connects with a wide range of platforms like Azure, Google Cloud, Docker, Kubernetes, and even on-premise servers.
How do I optimize AWS costs using monitoring tools?
You can save a lot on AWS costs by using monitoring tools like CloudWatch or Datadog. These tools help you see where your money is going, such as underused instances, idle storage, or unnecessary workloads. CloudWatch can alert you when usage spikes or drops, so you can scale your resources properly.
Why is AWS Security Monitoring Important?
AWS security monitoring is absolutely essential because it protects your cloud infrastructure from threats and unauthorized access. With tools like AWS CloudWatch and Datadog, you can track every action taken within your account, detect suspicious activity, and respond before damage occurs.
Can We use third-party AWS monitoring tools?
Yes, you can and sometimes you should. Third-party tools like Datadog, New Relic, and Dynatrace offer deeper analytics, better visualization, and easier multi-cloud integration. While CloudWatch is perfect for AWS-only environments, third-party tools give you a single view of all your systems.
What is the difference between these two AWS Monitoring Tools: CloudWatch and AWS X-Ray?
CloudWatch and AWS X-Ray serve different purposes. CloudWatch focuses on metrics, logs, and overall system health, it tells you what is happening. AWS X-Ray, on the other hand, is for tracing and debugging and it shows you why something is happening inside your application. CloudWatch might alert you that your app’s latency increased, while X-Ray helps you trace the request path to find which service or function caused it.
What is the best free and open-source AWS monitoring tool?
Zabbix is the best free and open-source option for AWS monitoring. Unlike CloudWatch, which is free only up to a limited tier, Zabbix has no licensing cost at any scale since you self-host it. It ships with official templates for CloudWatch data, covering services like EC2, RDS, and Lambda.
Conclusion
AWS monitoring tools are important for anyone who wants to ensure their cloud environment runs smoothly and efficiently. These tools help users like cloud engineers to IT managers can make quick decisions and perform accurate analyses by giving real-time insights into performance, security, and costs. With advanced AI automation, monitoring becomes even simpler, saving you time while enhancing productivity.
In this blog, we’ve listed some of the best AWS monitoring tools, including both free tools for AWS monitoring and affordable AWS monitoring tools. We’ve also highlighted their top features and pricing options, so you don’t have to waste hours scrolling through endless pages looking for the right solution.
Match the tool to your actual AWS footprint and budget rather than picking the biggest name on the list; a small team monitoring a handful of EC2 instances rarely needs the same platform as an enterprise running multi-region, multi-account infrastructure.
Comparison Table of AWS Monitoring Tools
In the table below, we’ve compiled all 10 top AWS monitoring tools so you can compare their features, free plans, and pricing at a glance.
| AWS Monitoring Tool | Key Features | Best For | Free Plan | Starting Price |
|---|---|---|---|---|
| AWS CloudWatch | End-to-End Observability, Smart Alerts | App Developers | Yes | $0.30 per custom metric/mo |
| Datadog | One-Click AWS Integration, Cost Management | Startups & Multi-Account Users | 14-day free trial | $15/month |
| New Relic | AWS Metric Streaming, Pre-built Dashboards | DevOps & Cloud Architects | 100GB/mo free ingest | $49/month |
| Dynatrace | Full-Stack Auto-Instrumentation, AI RCA | AWS Admins, Performance Teams | Limited-time free | $0.04 per host/hour |
| Grafana Cloud | Agentless Setup, 60+ AWS Services | Infra Teams & Cloud-Native Startups | Yes, limited scale | $49/month |
| LogicMonitor | Native AWS Integration, Alert Grouping | MSPs & Hybrid Cloud Users | 15-day free trial | $16/month |
| Site24x7 | AI Anomaly Detection, Cost Analytics | Cloud Architects, MSPs | 30-day free trial | $9/month |
| Sematext Cloud | Unified Observability, 100+ Integrations | Budget-Conscious Teams | 14-day, no card needed | $9/month |
| Better Stack | Modular Pricing, AI Root Cause Analysis | Modern DevOps Teams | Yes, 10 monitors free | $24/month |
| Zabbix | Open-Source, Official AWS Templates | Self-Hosting Technical Teams | Free forever | $0 (self-hosted) |


Table of Contents
- What is an AWS Monitoring Tool?
- 10 Best AWS Monitoring Tools in 2026
- 1. AWS CloudWatch - Overall Best AWS Monitoring Tool
- 2. Datadog - Best All-in-One AWS Monitoring Tool
- 3. New Relic - Best AWS Monitoring for Fast Setup
- 4. Dynatrace - Best AI-Powered AWS Monitoring Tool
- 5. Grafana Cloud - Best Agentless AWS Monitoring Tool
- 6. LogicMonitor - Best Hybrid & Multi-Cloud AWS Monitoring Tool
- 7. Site24x7 - Best AWS Cost & Uptime Monitoring Tool
- 8. Sematext Cloud - Best Budget AWS Monitoring Tool
- 9. Better Stack - Best Modern AWS Uptime & Incident Monitoring Tool
- 10. Zabbix - Best Free & Open-Source AWS Monitoring Tool
- Best Free AWS Monitoring Tools
- Factors to Consider When Choosing an AWS Monitoring Tool
- How to Set Up AWS Monitoring (Step-by-Step Guide)?
- What are some Common AWS Monitoring Challenges?
- What’s the Difference Between CloudWatch and Third-Party Tools?
- FAQs
- Conclusion
- Comparison Table of AWS Monitoring Tools